
Growth Flag is one of our leading tools providing evidence-led insights for places – it is a first-of-its-kind online tool designed with policy makers, commissioners, business decision makers and analysts in mind, providing comprehensive information about UK businesses and where growth potential exists. The key part of the Growth Flag Annual Report seeks to answer key questions on growth potential over the next year and facilitate local areas to enhance their strategic interventions based on the latest robust evidence.
The Growth Flag Power Outlook 2024 provides an innovative, forward-looking outlook on growth potential and its value in places. Using first-of-its-kind analysis, the outlook reveals new spatial patterns in the economy and for the first time allows direct comparison between places.
The Power Outlook analyses two scores. First, the Distribution of Growth Score which tells us the proportion of active businesses in an area which have high growth potential. Secondly, the Assets Score, which analyses the average total assets of those businesses, telling us how significant the growth potential may be to a local economy.
To build the outlook, we analysed the businesses in each upper-tier (or single-tier) local authority in the UK, focusing on those with high growth potential - those which are likely or very likely to achieve 20% growth in the next year. Growth Flag uses robust live micro-level data and multi-variate analysis to forecast this growth in individual businesses, with this data then aggregated up to sectors and local economies.
From the analysis, each local area was given a score of up to 218 for each of the two metrics. When put along two axis, we can see how different areas compare in the distribution of high growth potential and these average values.
Growth Flag data can be transformative for driving data-led strategy in places and to support local areas to maximise their growth potential. To help this, we set out the outlook by showing recommended strategic focuses for each area. Depending on their scores, each area is recommended one of five strategic focuses:
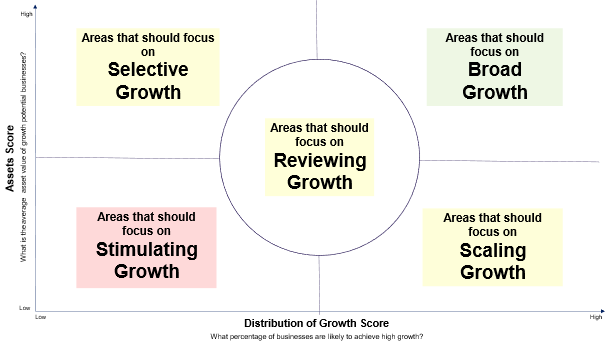
In a complex and changing economy, there is no set answer for where areas may hope to be on the chart. However, areas at the top of the chart show the best position for assets, while being in the top right also means there is the highest distribution of growth potential across the business base of any area. Let’s look at what the positions mean:
Selective Growth: These areas have high value growth potential concentrated in a small proportion of local businesses. We recommend that places including the City of London, Glasgow, Liverpool and Cambridgeshire should be selective in their focus of growth – decide here between consolidating the position of existing big players, or focusing on helping the longtail of lower value businesses to boost their growth potential.
Broad Growth: These areas have high value growth potential widely present in the local business base. Areas including Somerset, Lancashire, Bristol, Striling and Moray should embrace a strategy to continue building on their strong potential, without being complacent.
Reviewing Growth: These areas have a reasonable base of businesses with high growth potential and an asset base on which to build. Areas including Fife, Gateshead, Oxfordshire and Rhondda should review their current growth plans and secure more intelligence to consider how best to maximise their growth potential.
Scaling Growth: A high proportion of businesses in these places have high growth potential, but focusing on scale-up strategies and growing businesses to achieve higher asset values could be beneficial in areas such as Angus, Derbyshire, Norfolk, Lincolnshire and Wolverhampton.
Stimulating Growth: These areas have a large proportion of low growth potential business, compounded by small asset bases among businesses with higher growth potential. Areas including Blackpool, Birmingham, Hartlepool, Swansea and Wandsworth should focus on stimulating growth in businesses.
For each strategic focus, we suggest key questions that areas can ask to move towards maximising their growth potential.
Wondering where your area is on the Power Outlook? Check out the full Power Outlook and more insights and analysis in the Growth Flag Annual Report 2024.
The report challenges key assumptions about economic growth in the UK and shows that growth is everywhere, including in the places you may not expect it.
Growth Flag is one of GC Insight’s leading tools providing evidence-led solutions for local places. Find out more about how Growth Flag can help deliver insights for your place at growthflag.com.
